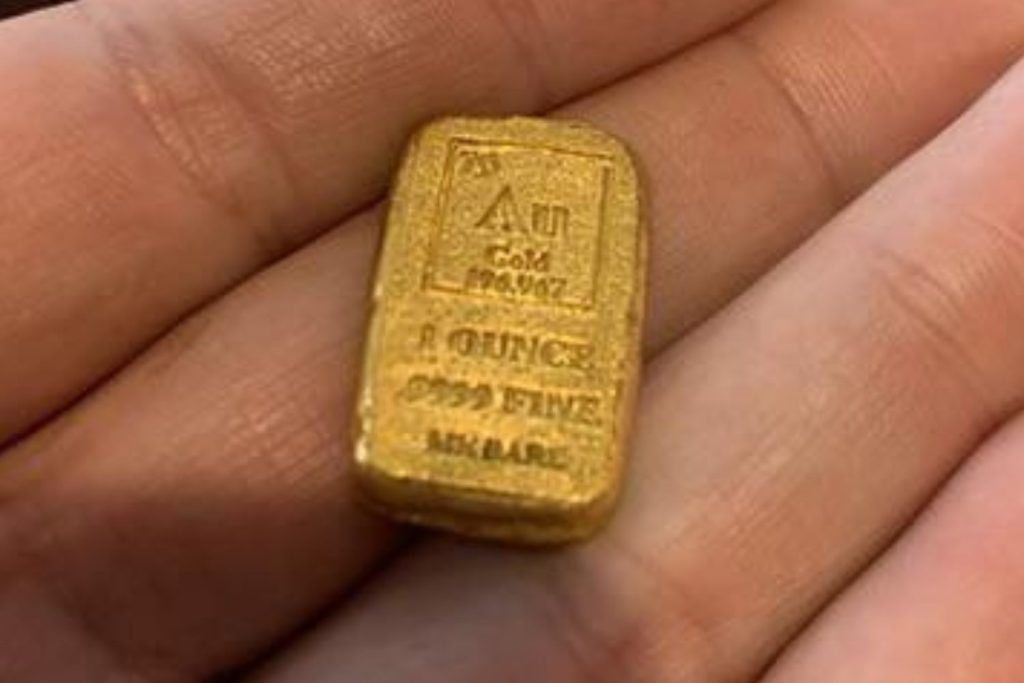
Gold vs Silver: Which Is the Better Investment?
Gold is usually the better choice for protecting wealth, while silver offers higher potential returns with much higher risk. Many investors hold both, often more gold than silver.
Key differences between gold and silver:
- Stability: Gold is less volatile and is the main safe-haven asset bought by central banks. Silver’s price can rise and fall roughly twice as fast. After a dramatic rally that pushed it above US$100 an ounce in January 2026, silver lost about half its value within months.
- Demand: Gold demand comes mostly from investors, central banks and jewelry. More than half of silver demand is industrial, from solar panels, electronics and electric vehicles. As a result, silver rises strongly when industry booms, but falls harder in a slowdown.
- Price per ounce: Silver costs a small fraction of gold’s price per ounce, so it’s easier for new investors to start buying.
- Storage and costs: For the same value, silver takes far more space than gold. It also usually has higher dealer premiums, and in some countries, such as the UK and EU members, silver carries VAT while investment gold does not.
- The gold-silver ratio: This ratio shows how many ounces of silver buy one ounce of gold. Many investors use it to time purchases. When the ratio is high, silver is cheap compared with gold. When it’s low, gold is better value. In just the past two years, the ratio has swung from about 120 to below 50.
In short, choose gold if you want stability and long-term wealth protection. Add silver if you can accept bigger price swings for the chance of larger gains.
Gold and silver have both delivered huge gains in the recent precious metals bull market, driven by geopolitical tension, inflation, central bank gold buying and a weaker US dollar. But they behave very differently. Gold is a monetary metal and the ultimate safe haven. Silver is both a store of value and a vital industrial metal for the green energy and technology boom.
This guide compares gold vs silver side by side, covering price performance, risks, demand, the gold-silver ratio, storage and costs, to help you decide which metal suits your goals. Track the live gold price per ounce, read our gold price forecast, and compare gold bar sizes and prices before you invest.
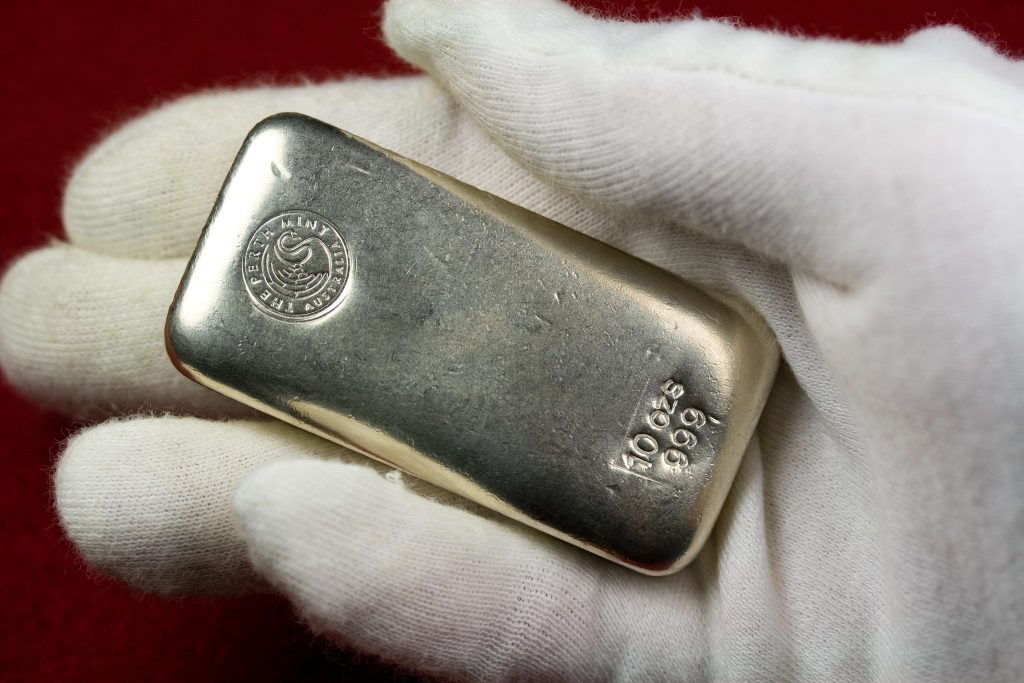
The Historic Rally: Silver’s Return to Glory
Flash back to 2010: Silver peaked at around $49.95 per ounce during a speculative frenzy fueled by loose monetary policy and fears of hyperinflation. It was a wild ride, with prices doubling in months before crashing back to earth.
Fast-forward to today, and silver is knocking on that door again. On September 26, 2025, it hit $46.07 per ounce, up 1.9% daily and 19.38% monthly, marking levels unseen since that fateful year.
Year-over-year, it’s up 45.7%, but the real story is the momentum: a 52.8% gain in 2025 so far, transforming it from gold’s sidekick to a standalone star.
What sparked this resurgence? Supply constraints meet insatiable demand. Silver production is largely a byproduct of base metal mining (like copper and lead), which slows during economic jitters—exactly what’s happening now with recession whispers and tariff threats.
Meanwhile, industrial demand exploded to a record 680.5 million ounces in 2024, projected to climb higher in 2025 thanks to solar panels, electric vehicles (EVs), and AI servers.
Solar photovoltaic (PV) alone gobbled 17% of supply last year, and with prices up 50% over two years, manufacturers like Intel are scrambling to recycle and hedge.
In Pakistan, a key silver market in South Asia, the per-tola price reflects this global frenzy. As of September 25, 2025, it stood at Rs. 4,675, up from previous levels amid a Rs. 105 daily spike—mirroring broader volatility but underscoring local investor fervor.
For context, one tola equals about 11.66 grams, making silver accessible for everyday buyers in emerging markets where it’s prized for jewelry and remittances.
This rally isn’t hype; it’s structural. The gold-to-silver ratio, a barometer of relative value, has ballooned to 82:1 (ounces of silver needed to buy one ounce of gold), far from the historical mining ratio of 7:1. If silver normalized to that, it’d trade at over $500 per ounce—a moonshot scenario that’s got traders salivating.
But even conservatively, analysts see $50 imminent, with triple digits on the horizon. Silver’s volatility—twice that of gold, with a standard deviation of 27-28 versus gold’s 12—adds thrill, but it’s this leverage that amplifies returns in bull markets.
Gold Miners’ Bonanza: Margins That Defy Gravity
Gold’s price surge is a boon for miners, but silver’s momentum is supercharging profits in ways that rewrite balance sheets.
At current gold prices averaging $3,284 per ounce in Q2 2025 (up 41% year-over-year), the sector’s average profit margin has ballooned to nearly 40%—more than double the 10-year average of 18.7%.
All-in sustaining costs (AISC) hover around $1,380 per ounce, stable despite inflation, yielding margins of $1,904 per ounce for pure gold plays.
But here’s the kicker: Many miners extract silver as a byproduct, and with silver’s 50% price jump amplifying revenues, overall profits have leaped 50% on just a 26% price rise for the metals combined.
Consider the math. A typical mid-tier miner like Hecla or Coeur d’Alene pulls 7 ounces of silver for every ounce of gold from the ground.
At $3,759 gold and $45.51 silver, that’s $3,759 + (7 x $45.51) = $3,759 + $318.57 = $4,077.57 in gross revenue per “unit” mined.
Subtract AISC of ~$1,380 for gold-equivalent costs, and you’re left with over $2,700 per ounce equivalent— a staggering 66% margin, up from 40% a year ago.
This isn’t linear; operational leverage means a 10% metal price hike can boost profits 30% or more, depending on fixed costs and debt.
The data backs it: Seven straight quarters of 31-90% year-over-year profit growth, with Q4 2023 margins at $635 per ounce despite costs rising to $1,342. In 2025, as silver squeezes supply chains, expect even fatter margins.
Leading producers like Newmont and Barrick trade at bargain P/E ratios of 9.8 and 11.2, despite record cash flows—undervalued gems in a sector that’s only leveraged gold’s 88.6% bull run by 1.2x so far, versus the historical 2-3x.
For silver-focused juniors like those in the GDXJ ETF, the upside is parabolic: A silver pop to $50 could ignite 50-100% stock gains overnight.
This margin expansion isn’t abstract—it’s fueling expansions. Miners are ramping output in high-grade deposits, hedging costs via long-term contracts, and returning capital via buybacks.
In a world of $34 trillion U.S. debt and Fed rate-cut bets, these profits provide a buffer against downturns, making miner stocks a leveraged play on the safe-haven theme.

The #SilverSqueeze: Hedge Funds Join the Frenzy
No discussion of silver’s surge is complete without the elephant in the room: #SilverSqueeze. This hashtag, echoing the 2021 Reddit-fueled mania that spiked prices 18% in days, is trending with top posts amassing thousands of likes and reposts.
As of late September 2025, it’s dominated conversations, with users like @tradition_money noting the skewed mining ratio could propel silver to $500+. Videos of “apes” celebrating $45 breaks and memes of shorts covering at $300 have gone viral, blending retail FOMO with institutional intrigue.
At its core, the squeeze stems from a structural deficit: 800 million ounces since 2021, with COMEX stocks down 70% and LBMA free float near zero. ETFs like SLV have seen massive inflows—Saudi Arabia alone bought 932,000 shares worth $30.58 million in August—draining vaults by 9.5 million ounces in days. Borrow fees for shorting SLV spiked to 5%, signaling tightness as shorts scramble.
Enter hedge funds: Once silver’s suppressors via massive shorts (over 200 million ounces in paper contracts), they’re rotating in. Bullion banks like JPMorgan, caught flat-footed, are liquidating crypto holdings to cover, per X analysts. Institutions view silver as a portfolio hedge against de-dollarization and AI-driven demand, with clean energy sucking up supply.
This rotation isn’t speculative—it’s strategic. Central banks like Russia and Saudi Arabia are remonetizing silver after decades of gold focus, while the U.S. lists it as a critical mineral for national security.
Backwardation in futures (spot > futures) screams physical tightness, a 2,500-year anomaly per experts like Mike Maloney. If shorts cover en masse, prices could gap to $120, then $300, as one top post predicts.
Gold vs Silver: Who Wins the Safe-Haven Crown?
Gold’s allure is undeniable: Central banks hoarded 1,037 tons in 2024, viewing it as pristine collateral. It’s less volatile, with broader liquidity, making it the go-to for sovereign wealth.
But silver’s edge lies in its volatility-fueled upside. While gold amplifies steadily, silver’s industrial tether supercharges rallies—demand from EVs and solar could add 100 million ounces annually by 2030.
Risks? Silver’s beta means sharper drawdowns; a 2021-style crash followed its squeeze. Geopolitics like tariffs could crimp supply chains. Yet, with deficits widening and ETFs draining stocks, the floor feels solid. Forecasts peg silver at $48-50 by year-end, potentially $100 in 2026 if squeezes persist.
Conclusion: Time to Stack the Sleeper?
Gold’s at all-time highs, but silver’s the real story of 2025—a breakout to 2010 peaks, miner margins exploding 50% on modest price gains, and a #SilverSqueeze drawing hedge funds like moths to flame.
In this safe-haven showdown, silver offers not just preservation but proliferation: Hedge against fiat folly, bet on green tech, and ride the squeeze wave.
For investors, diversify: 60% gold for stability, 40% silver for spark. Buy physical bars or coins to sidestep paper traps, or dip into miners/ETFs like SLV for leverage.